Commodities, Price Drivers, and Outlook
In this edition, we aim to provide a broader perspective on commodities, given their importance to Latin America and the high volatility in their prices. These goods are not only influenced by market dynamics but are also subject to unexpected supply shocks and climate-related disruptions.
Overall, commodity prices corrected downward in 2023 and 2024, following the surge seen in 2022 when the war between Ukraine and Russia began. Despite this correction, metals (green line in the chart) have remained relatively high in price. This reflects several factors: increased demand driven by the energy transition, improved urbanization prospects in Asian countries—which imply higher future energy consumption—and demand for safe-haven assets amid global uncertainty (e.g., gold), which tend to be less sensitive to economic cycles.
Meanwhile, the agriculture index (blue line) has been the least volatile, indicating improved weather conditions throughout 2024 and into 2025. Lastly, the energy index (pink line in Chart 1) has seen the sharpest decline, with oil and gas prices falling by more than 13% and 3%, respectively, so far this year. This drop is largely due to global oversupply and expectations of weaker demand stemming from the ongoing trade war between the United States and China.
Chart 1: Commodities Price index (Index)
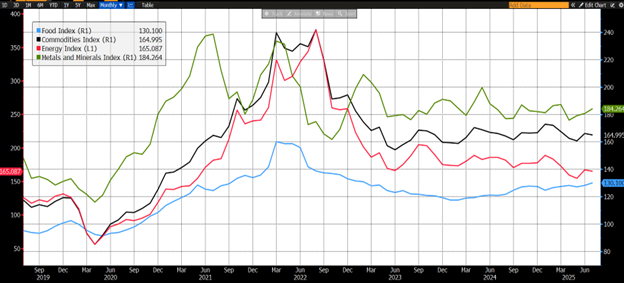
Source: Bloomberg.
Metal prices are expected to remain high, with a potential upward trend. Gold has benefited significantly from the uncertainty surrounding the change in U.S. government, appreciating by 27% so far this year. This makes it a textbook example of the "safe haven" effect in metal demand. However, this upward trend could be temporary if uncertainty begins to fade.
Meanwhile, metallic minerals are likely to continue trending upward regardless of trade tensions, as they play a crucial role in both the energy transition and urbanization processes. Copper, along with silver, is one of the most conductive metals, making it a key input in the design of electric vehicles and energy transmission networks. For instance, an electric vehicle uses on average three times more copper than a conventional combustion vehicle. Various forecasts suggest that the transportation sector's share of copper demand will rise from the current 11% to nearly 20% by 2040.
Another compelling example is urbanization. China and India, the world’s most populous countries, have relatively low urbanization rates for emerging economies. China stands at just 67%, and India below 40%, compared to 83% in the U.S., 92% in Japan, and 88% in Brazil. As China and India continue to develop economically, urbanization is expected to accelerate, driving increased demand for public services such as energy. Copper will be essential in this process. Although China is the world’s largest copper consumer, its per capita copper inventory in use is only half that of advanced economies. In India, per capita energy consumption is just one-seventh of Japan’s, indicating significant growth potential in energy demand—and consequently, copper prices—over the medium and long term, especially given that supply is not expanding at the same pace.
A third factor to watch is the energy demand driven by digitalization. Artificial intelligence is increasingly electricity-intensive, and projections indicate that the digital sector’s share of global energy demand will grow fivefold over the next 20 years.
Chart 2: Urbanization vs. Electric power consumption per capita (%, kWh)
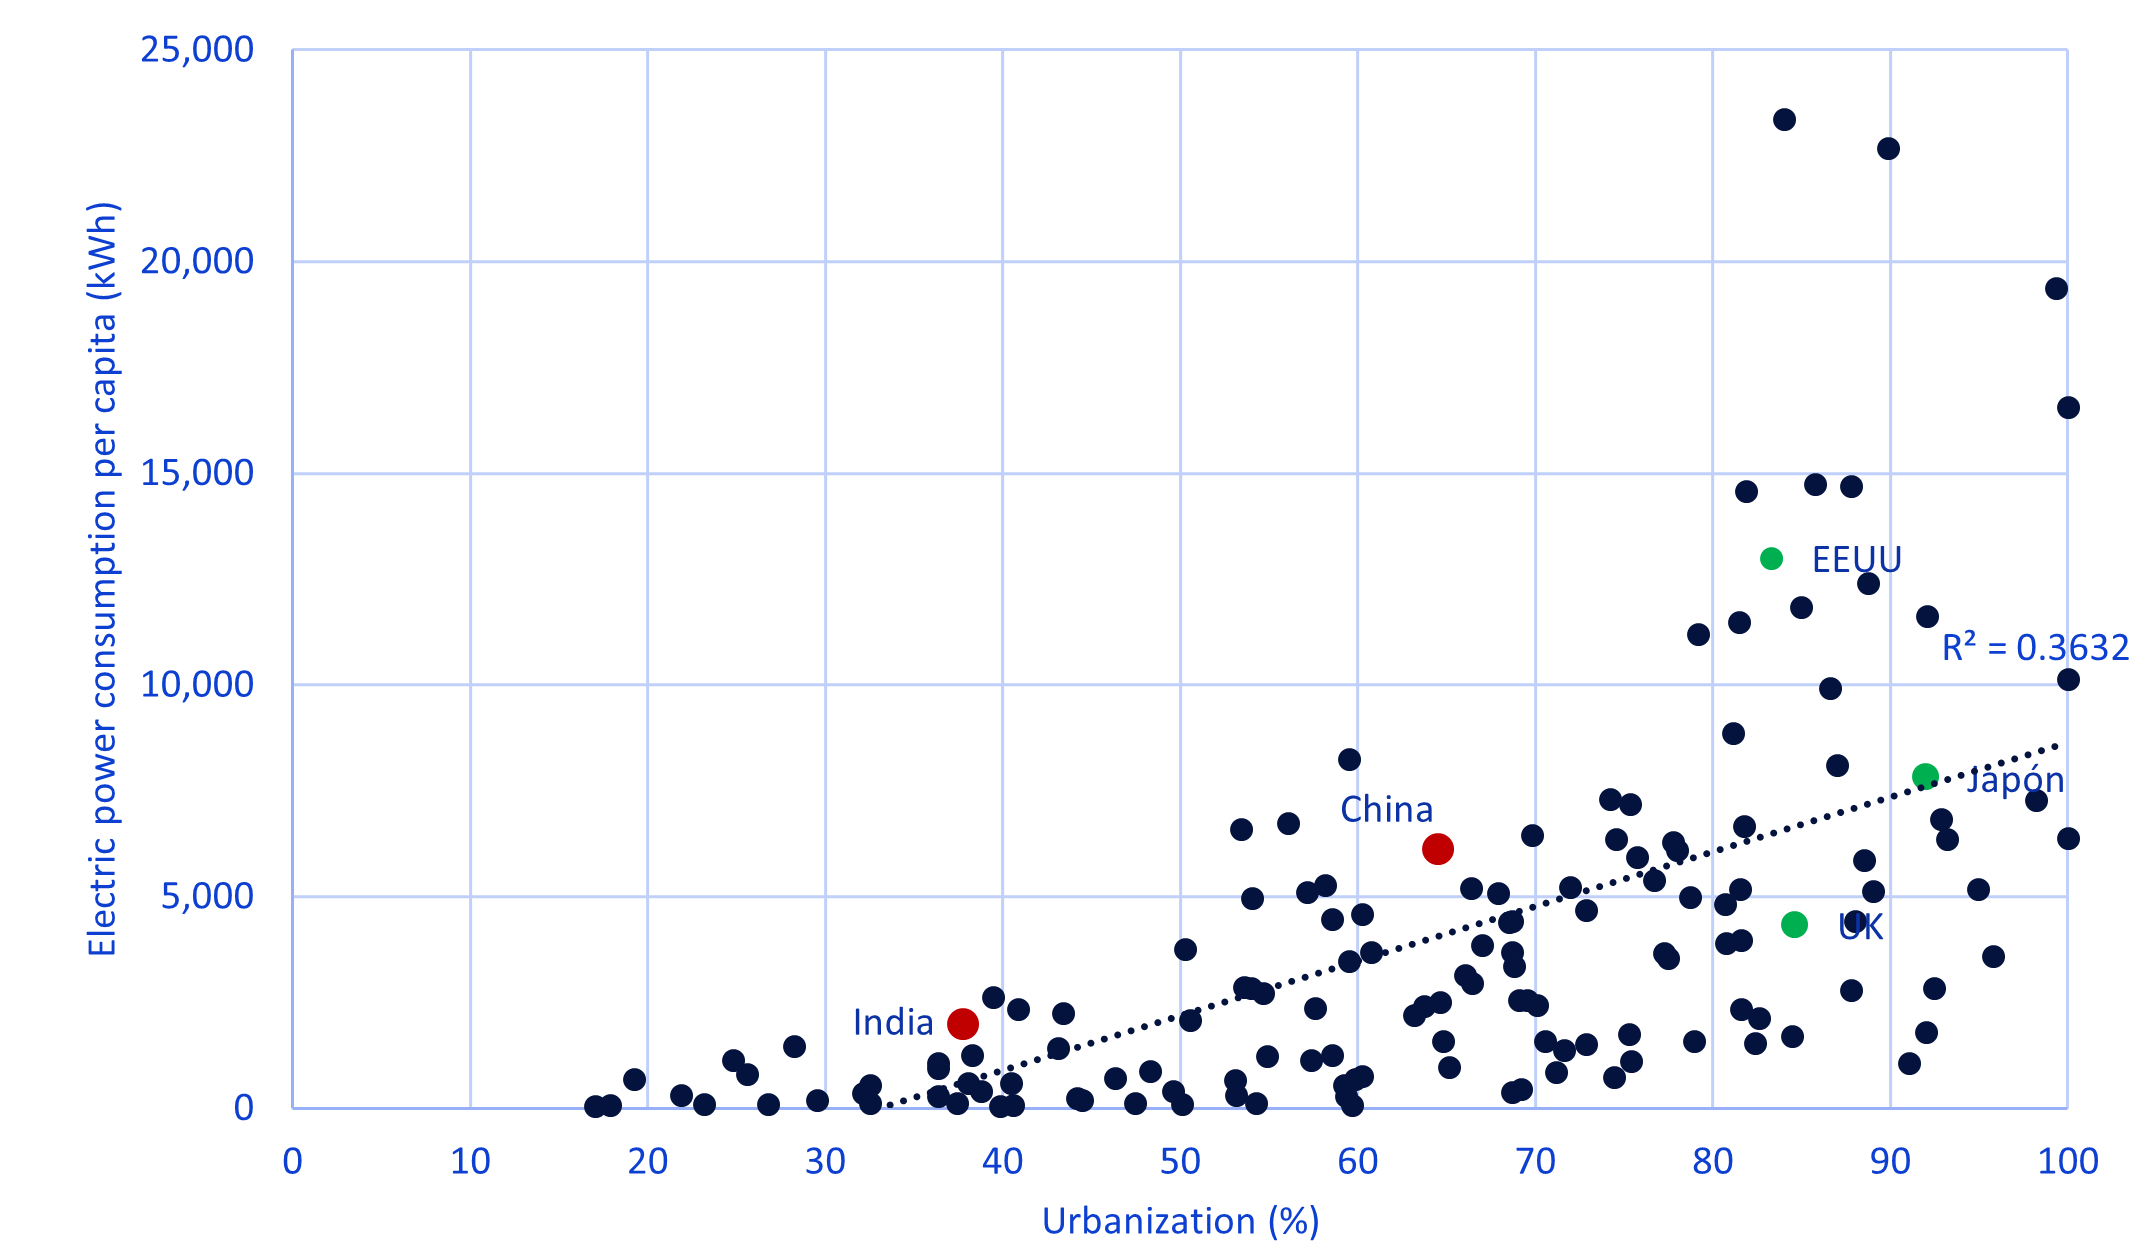
Source: World Bank – IMF – Estudios Económicos.
Are there risks to food prices?
Although food prices have been relatively less volatile recently, they remain highly sensitive to climate conditions. Between 2020 and 2023 (see Chart 3), the region experienced multiple climate shocks—two La Niña events and one El Niño—which significantly impacted agricultural yields in the southern part of the region due to severe droughts (affecting Argentina, Uruguay, Paraguay, and Brazil). These events also led to power outages in Central America, Mexico, and Ecuador, and caused infrastructure damage and disruptions in the service sectors of the Caribbean, particularly tourism.
Meteorological agencies currently forecast neutral (normal) climate conditions for the coming months. However, the probability of a new La Niña event occurring in early 2026 has recently increased—though it is not the baseline scenario. If it materializes, it could pose risks to the southern part of the region due to potential droughts. In contrast, La Niña typically brings increased rainfall to Central America and the Andean region (Peru, Colombia, and Venezuela).
Chart 3: Weather Intensity (°C)
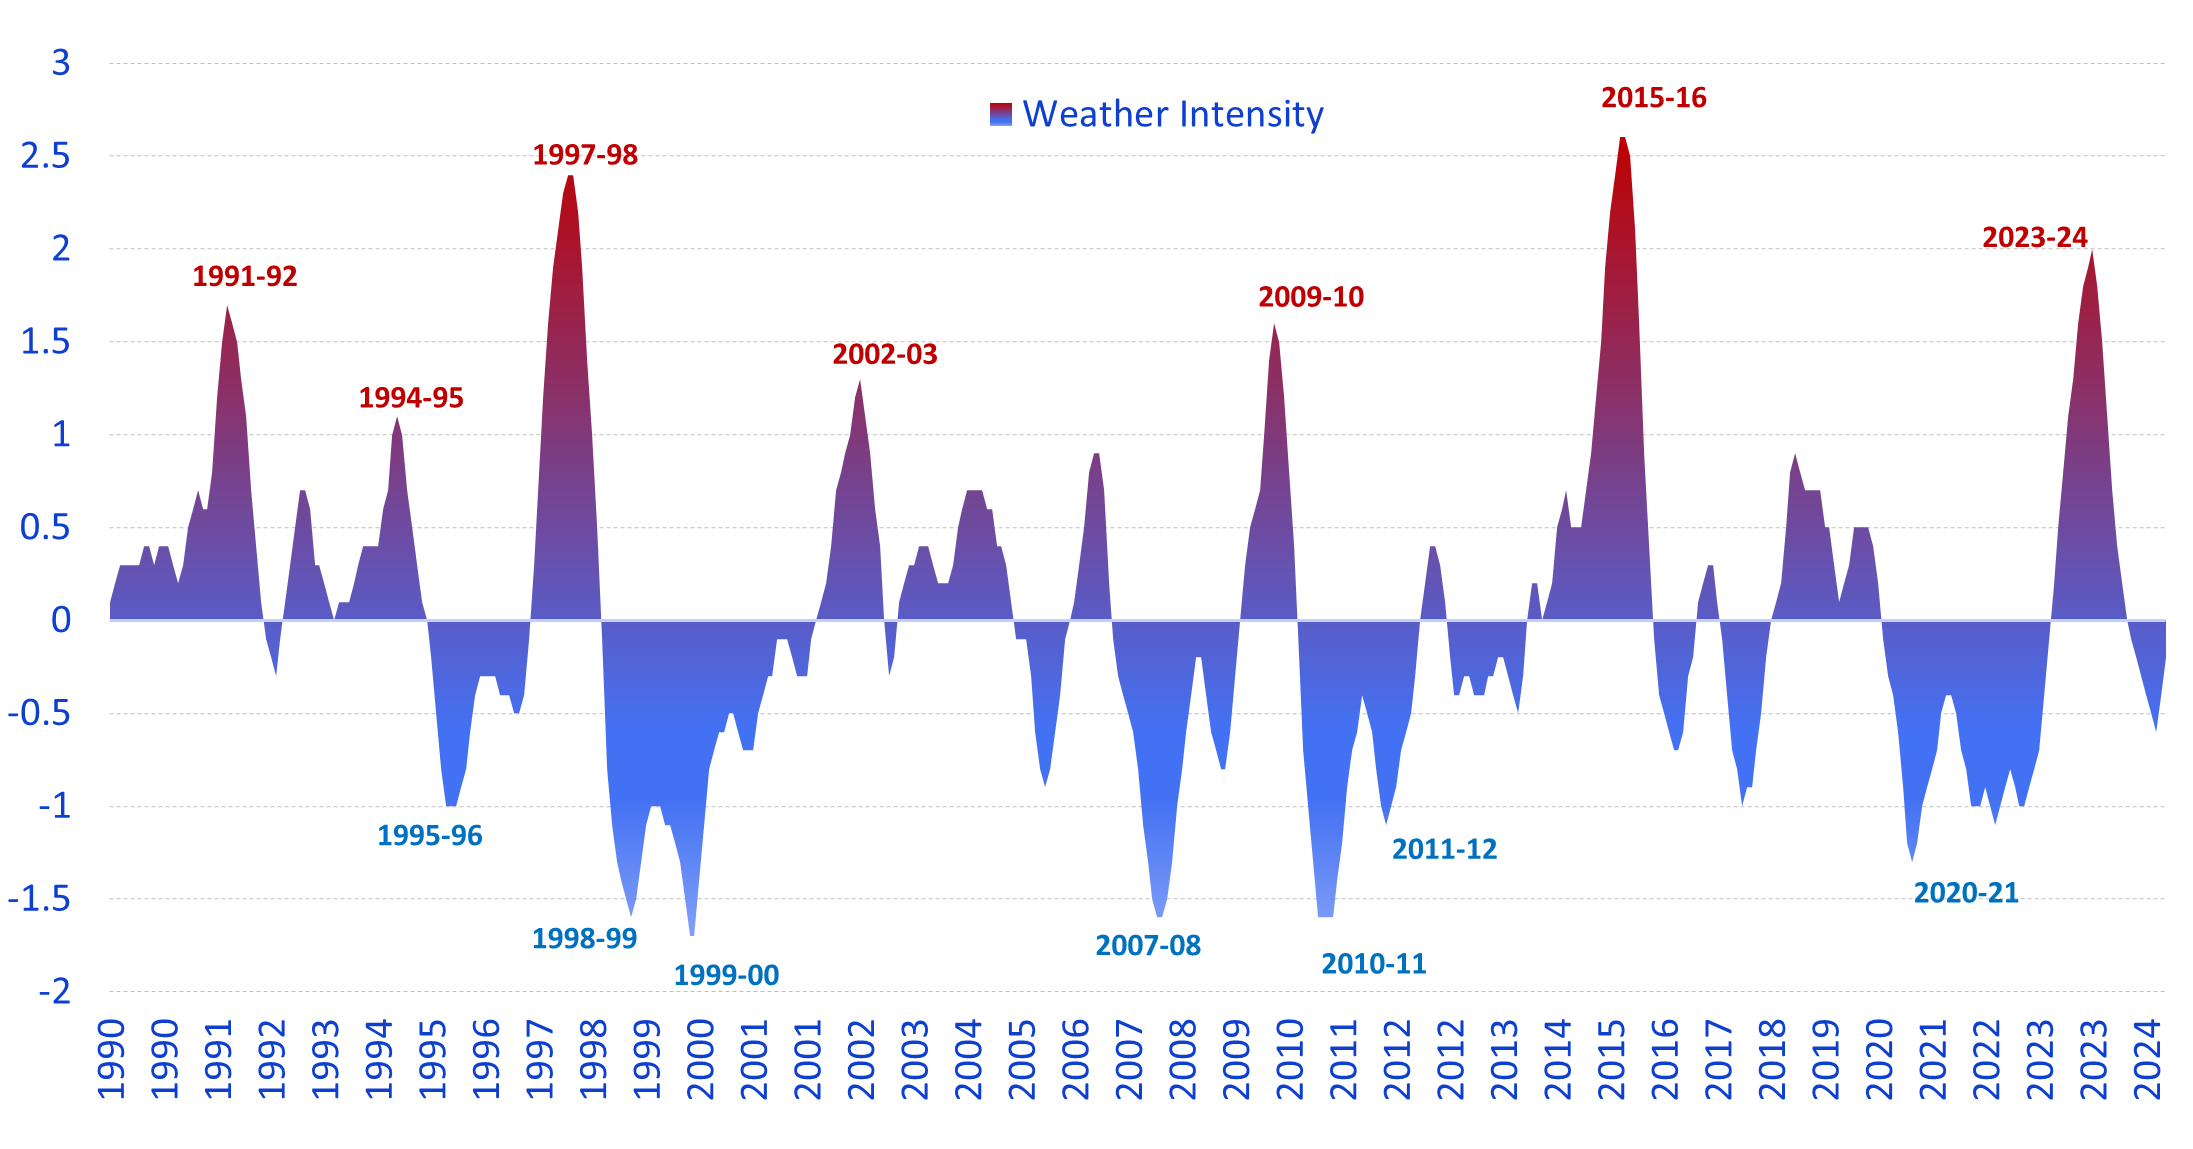
Source: ENSO – NASA – Estudios Económicos.
Structurally, oil prices are likely to face downward pressure.
The global economic slowdown, rising production levels, and the ongoing energy transition are all factors weighing against oil prices. Under these conditions, it is unlikely that we will see oil prices return to—or even approach—levels above USD 100 per barrel.
Forecasts from both OPEC (Organization of the Petroleum Exporting Countries) and the EIA (U.S. Energy Information Administration) indicate that while both supply and demand are expected to grow in the coming years, supply is projected to outpace demand (see Chart 4). As a result, the market is likely to experience a continued surplus of oil, which could exert further downward pressure on prices.
Chart 4: Oil: Production vs. Demand (Million barrels per day)
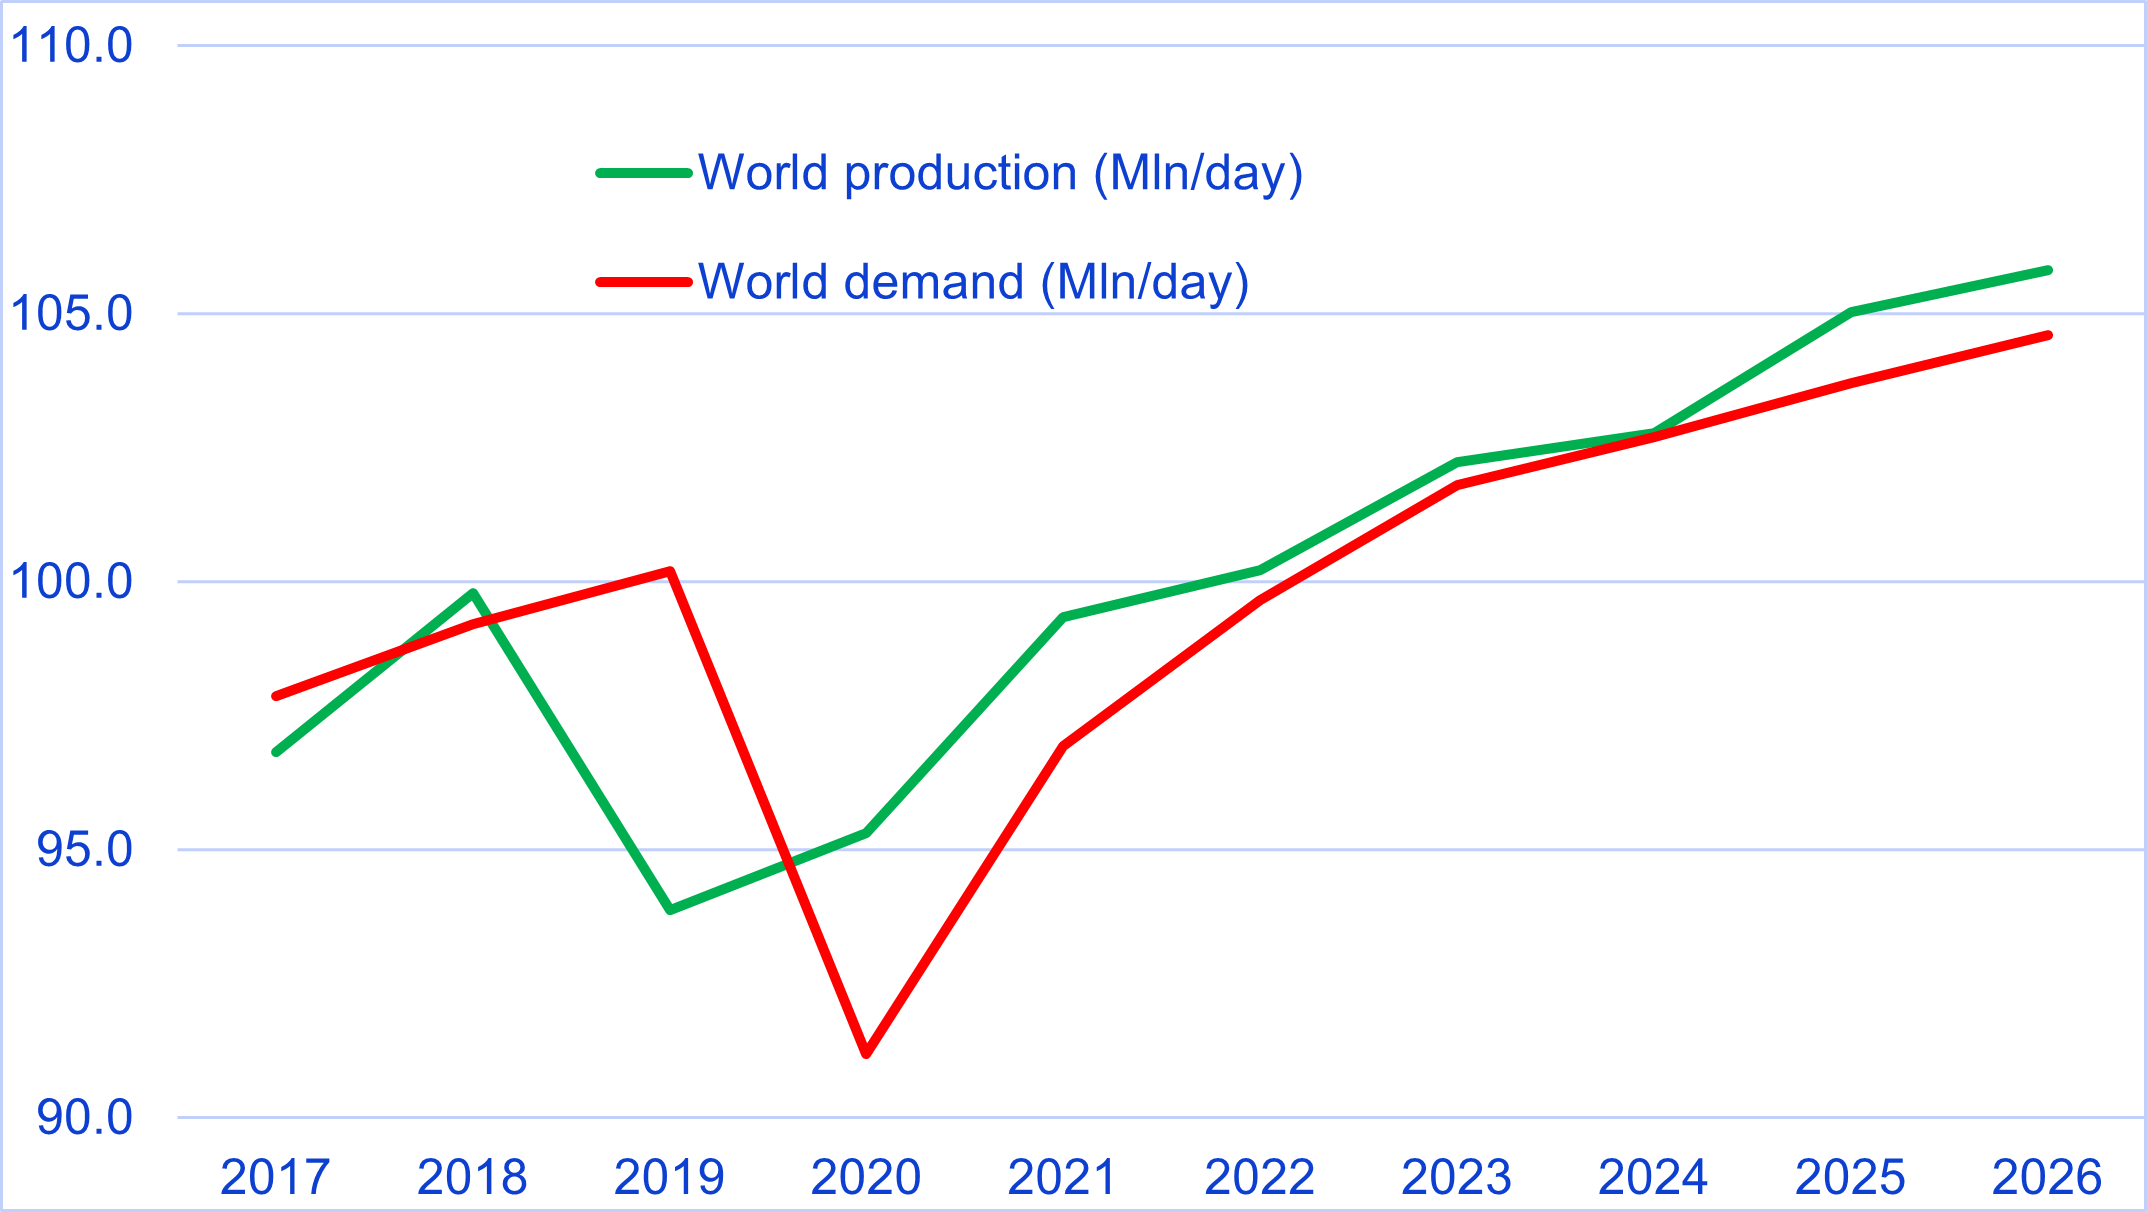
Source: OPEC – EIA – Estudios Económicos.
According to estimates, the oil market is currently experiencing a supply surplus of approximately 1.3 million barrels per day (see Chart 5).
While this figure may seem modest, it indicates that the market continues to show signs of oversupply—a trend that has persisted since 2020. Moreover, in a scenario where the global economy is slowing and major producers (such as OPEC) are increasing their production quotas, it is reasonable to expect that oil prices may remain subdued for some time.
That said, no analyst or market participant anticipates that fossil fuels will cease to be essential to the global energy mix. In fact, fossil fuels currently account for around 80% of total world energy production.
Chart 5: Oil market: Surplus vs. Deficit (Million barrels per day)
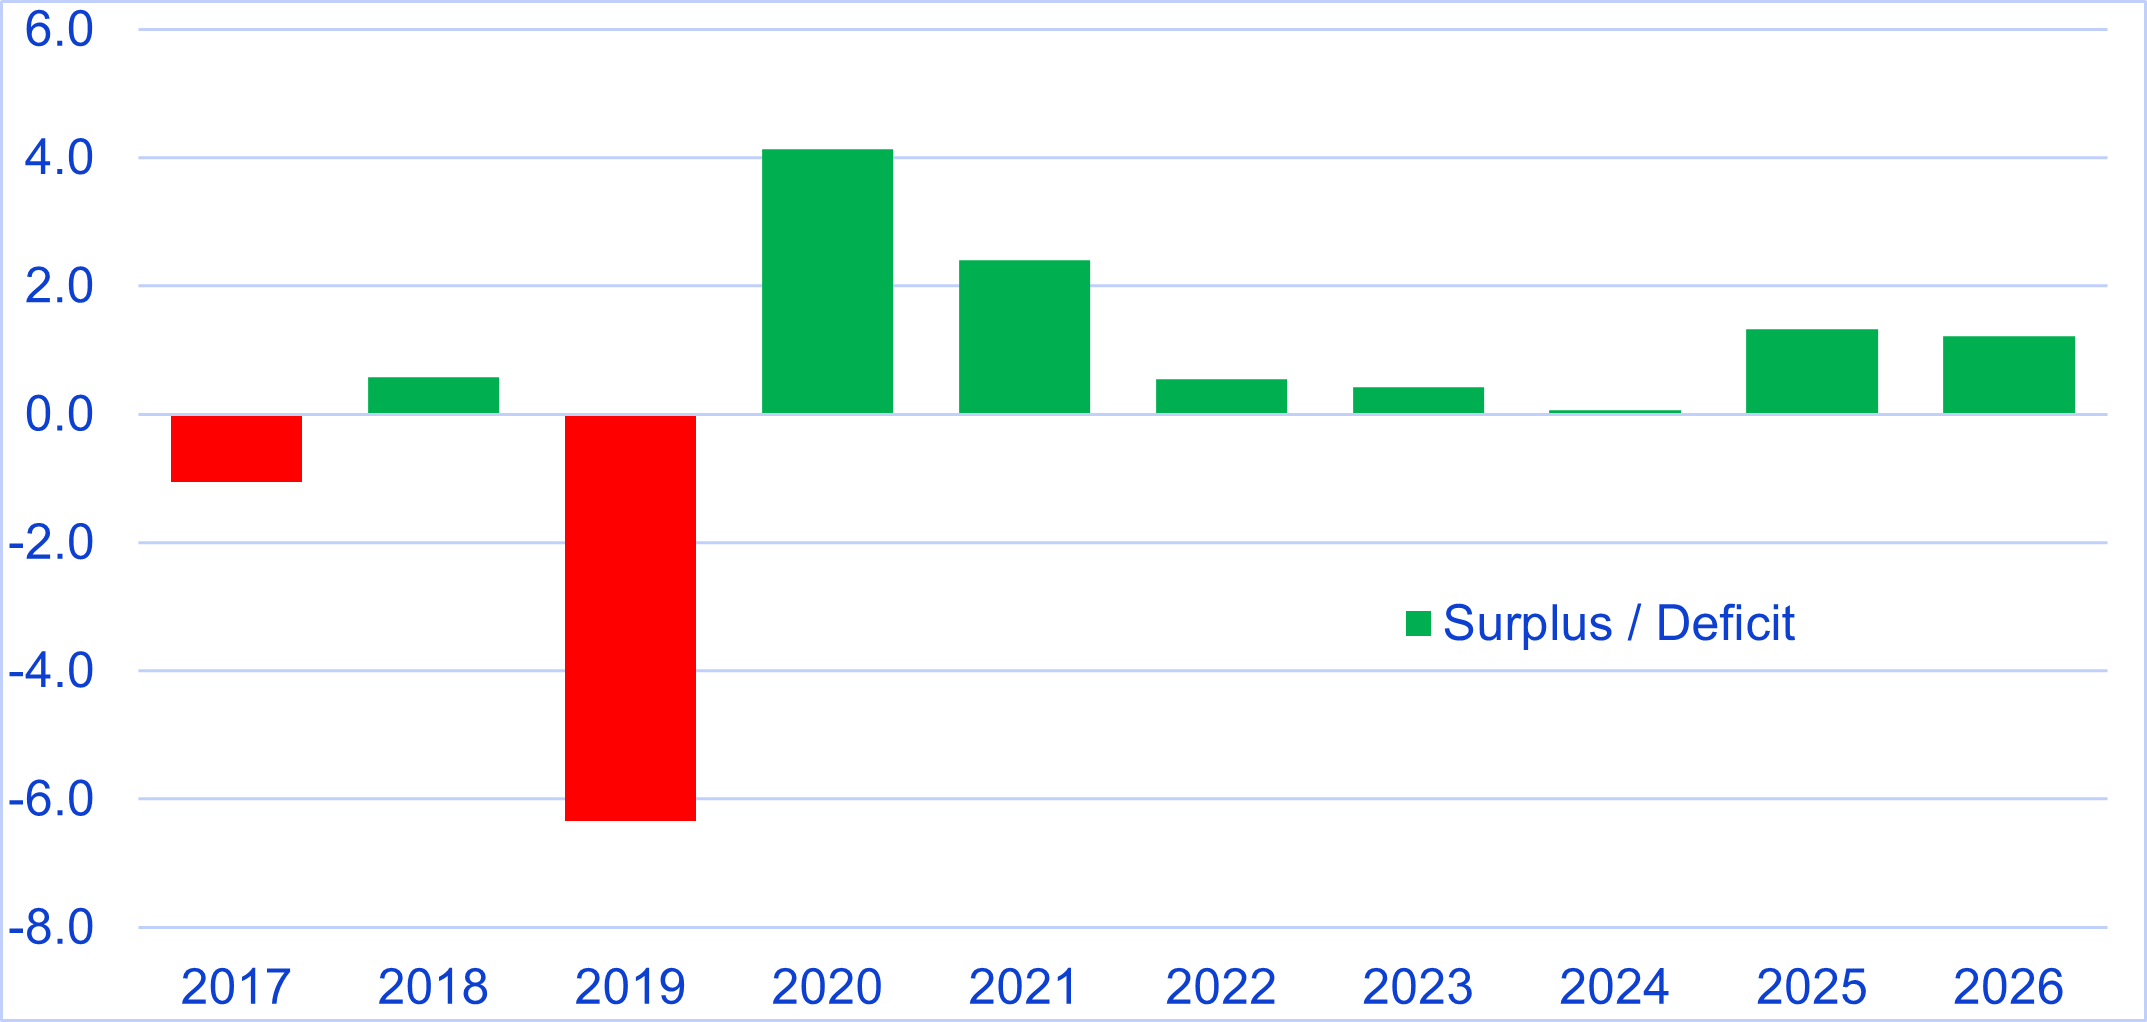
Source: OPEC – EIA – Estudios Económicos.
In summary, the behavior of different commodity classes varies significantly, which means their price trajectories—especially in the medium term—also diverge.
The bearish outlook for the fuel basket contrasts with the strong fundamentals supporting growth in the metals sector, particularly copper. Meanwhile, food prices remain highly dependent on climate conditions.
Nonetheless, commodities will continue to be essential for global production and consumption. While each category has distinct fundamentals, market reactions are natural. There are short-term opportunities—such as in coffee—and long-term sustainability prospects in metallic minerals, as well as continuity in the energy matrix for fossil fuels. Understanding the risks in each market makes commodity investment attractive.
This is precisely where Latin America, and especially South America, remains appealing to international markets, given that most countries in the region are net exporters of raw materials. That said, it is crucial not to lose sight of the need to diversify the region’s export matrix to reduce dependence on these types of products.