Foreign Trade: Evolution of Trade War 2.0 and Its Effects on the Region
Sergio Olarte
Macro Reasearch Department
A/ Abstract
- Changes in U.S. trade policy and its ongoing adjustments have had significant impacts on global growth and inflation expectations. Latin America has not been immune to these effects, although the magnitude varies depending on each country's level of trade exposure to the United States.
- This year has been marked by pauses in most of the tariff measures implemented; the current context makes it clear that a nearly 0% trade tax scenario is gone.
- The new normal shows that most countries in the region face general tariffs of around 10%, which initially represents a comparative advantage over regions facing higher rates, such as Asia and Europe that face much higher tariffs.
- A relevant aspect to consider is Latin America's low share in U.S. imports. Altogether, the region's participation (excluding Mexico) barely reaches 4.4% of total U.S. imports.
- The outlook changes dramatically when it comes to regional exports. The United States, along with China, stands as one of the region's main trading partners. On average, exports to the U.S. represent about 7.0% of each Latin American country's GDP, and in many cases, more than 40% of total exports.
B/ Key Considerations
Trade tensions have had multiple episodes throughout the year, leading to adjustments in global growth expectations and, naturally, in inflation projections, as slower growth is expected due to reduced international trade, along with higher inflation in the U.S, at least due to increased import costs and a weaker dollar. Despite the year has been characterized by pauses in most of the measures implemented, the current context makes it clear that the scenario of 0% tariffs from the U.S will not return. In fact, the U.S government has been emphatic in stating that minimum tariff rates will start at 10%.
Chart 1: General tariff percentages currently in effect for Latin America (%)

Source: The White House –Bladex Economic Research * Mexico has differentiated tariffs for certain products. Although most of its exports (85%) are covered by trade agreements with the United States.
In the case of Latin America (Chart 1), most countries face general tariffs of 10%, which initially represents a comparative advantage over regions with higher rates, such as Asia and Europe. However, this percentage is not uniform: Costa Rica, Ecuador, and Bolivia face tariffs of 15%; Mexico has a differentiated tariff scheme; and Brazil, due to the IEEPA sanction, faces an accumulated tariff of 50% on a large portion of its products.
Chart 2: Latin America's share of US imports (%)
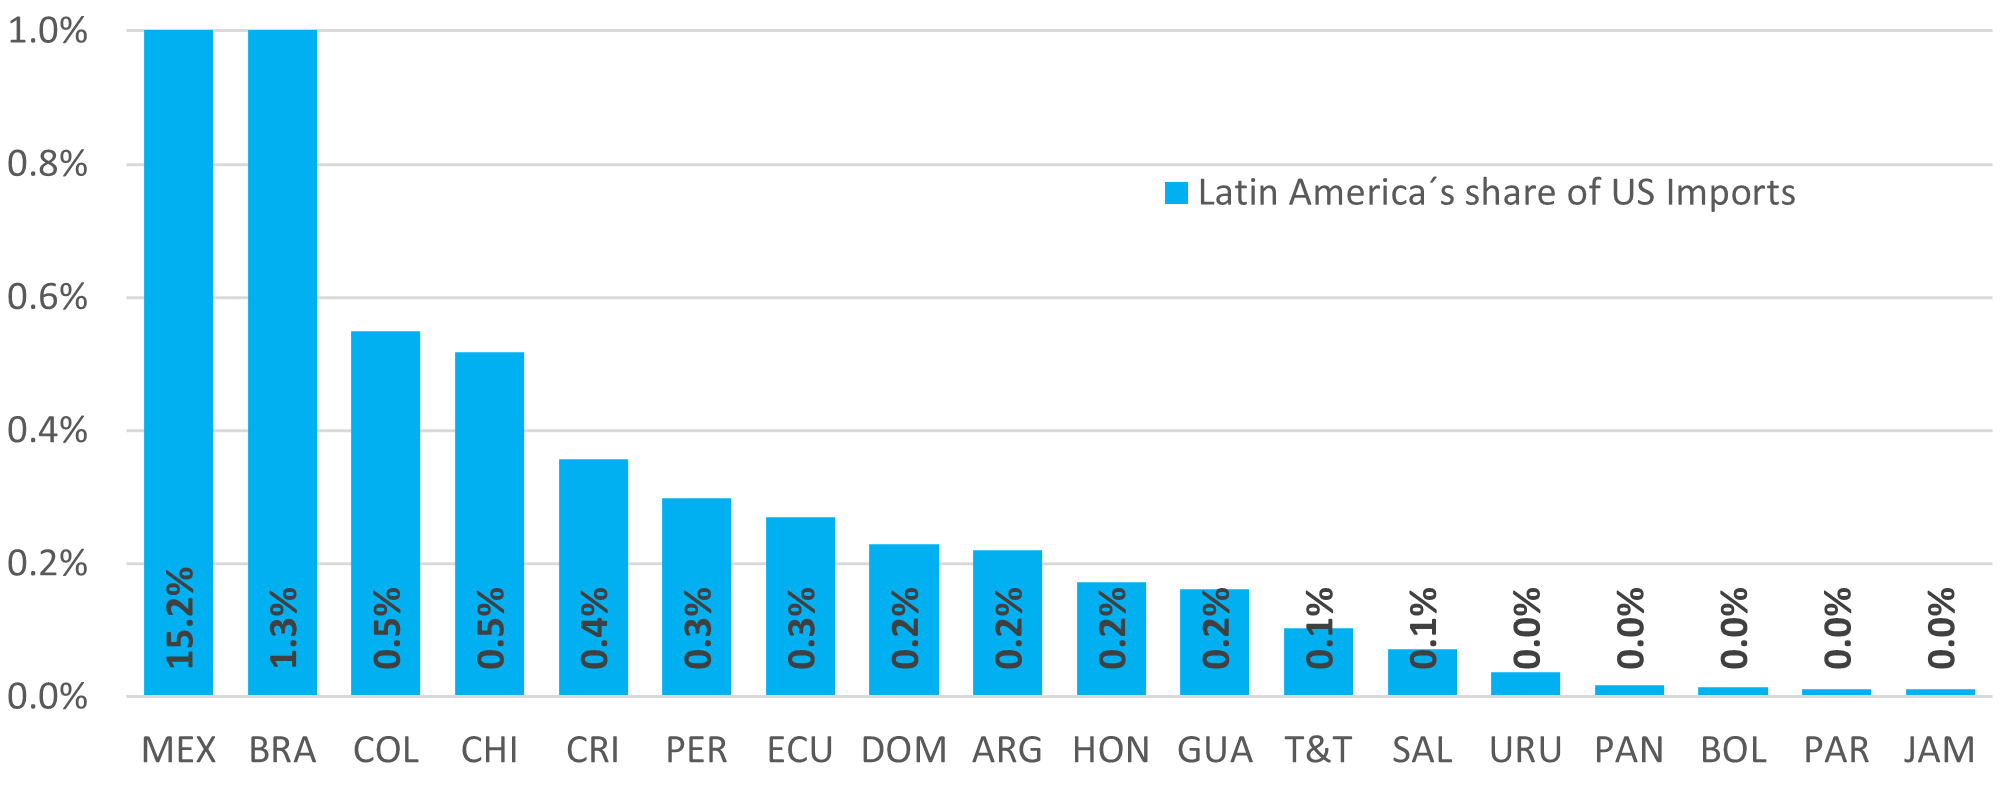
Source: The EIU – Trademap – Bladex Economic Research.
A relevant aspect to consider is Latin America’s low share in U.S. imports (Chart 2). Excluding Mexico —the main U.S. trading partner, with a share close to 15%— the rest of the countries in the region each represent, in most cases, less than 1.0%. Altogether, Latin America's share (excluding Mexico) barely reaches 4.4% of total U.S. imports.
Chart 3: Exports to the U.S. vs. Total Exports (% share, % of GDP)
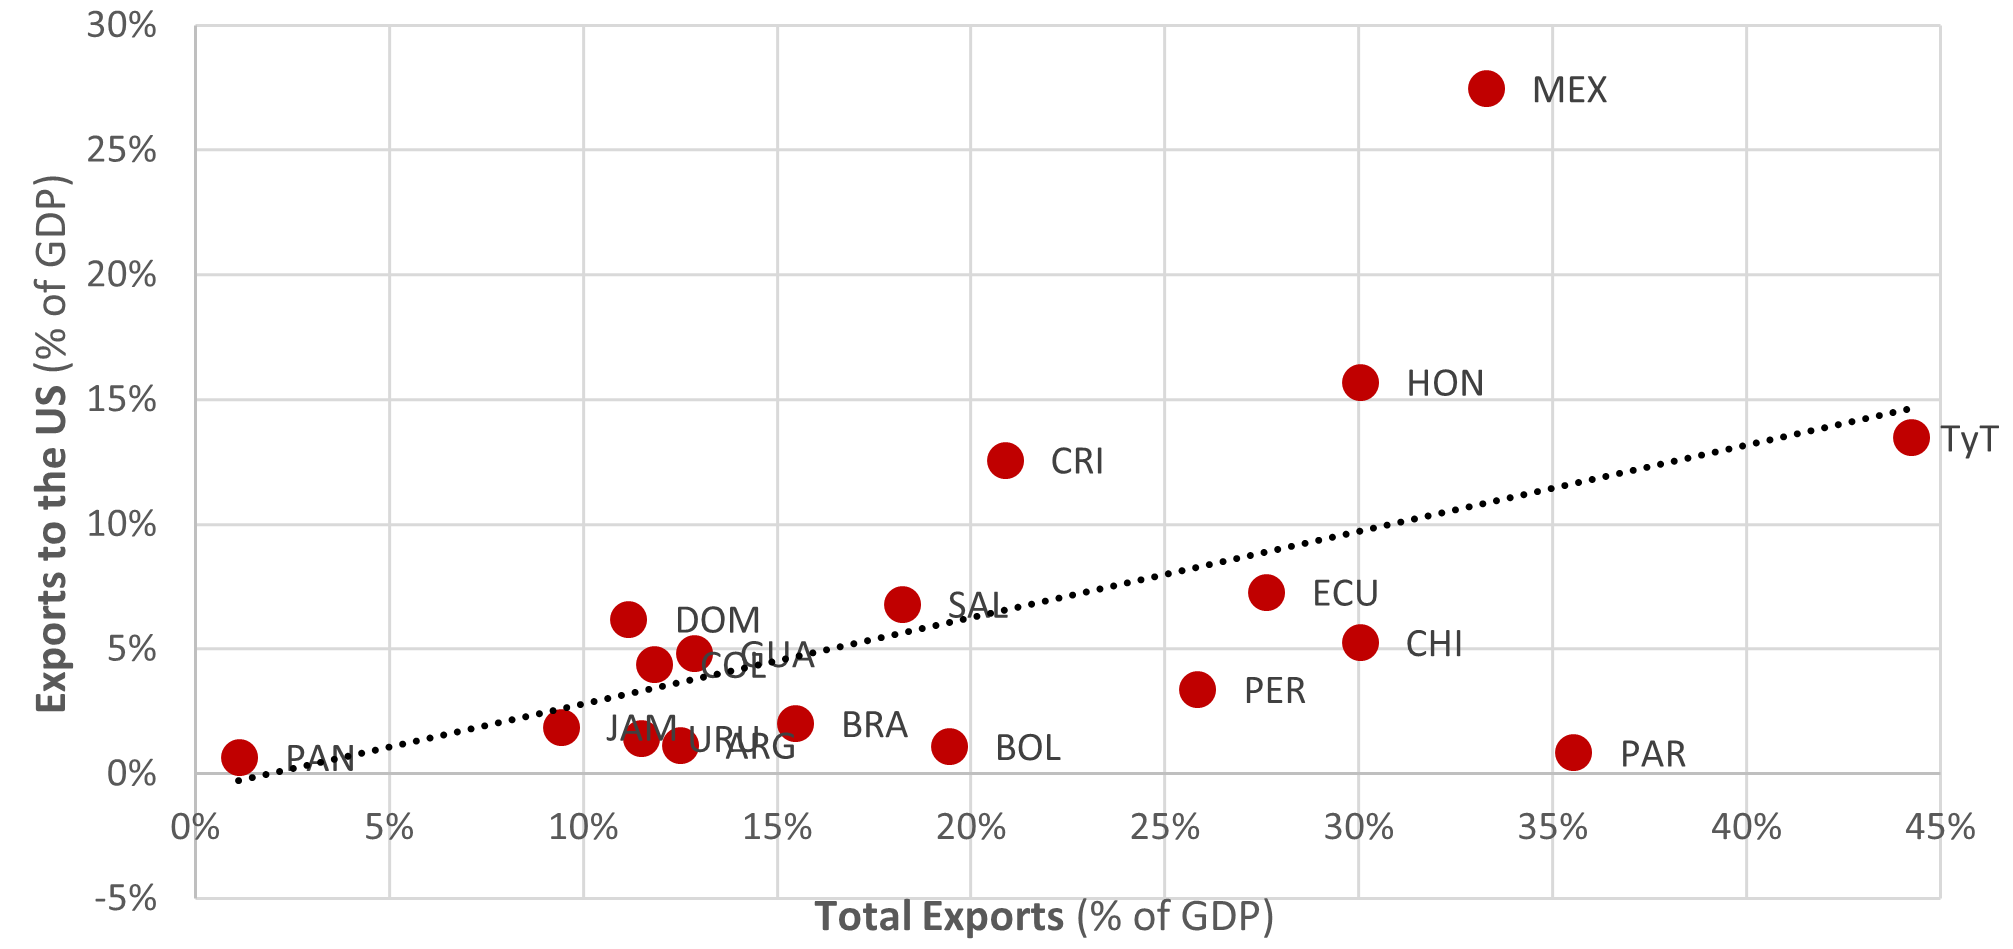
Source: The EIU – Trademap – Bladex Economic Research.
This scenario, in our opinion, creates a strategic window: the relatively low tariff burden faced by Latin America compared to other regions could become a competitive advantage to expand its market share in U.S imports. Seizing this opportunity will require efficient coordination between trade policy, productive investment, and sectoral positioning.
Although Latin America — excluding Mexico—has a marginal share in U.S imports and, therefore, in its GDP, the outlook changes dramatically when it comes to regional exports (Chart 3). The United States, along with China, stands as one of the region´s main trading partners. On average exports to the U.S represent about 7.0% of each Latin American country´s GDP.
- This bilateral relationship becomes especially relevant in economies with high trade concentration. Mexico is the most exposed case: 80% of its exports go to the United States, which is equivalent to approximately 28% of its GDP. Honduras and Costa Rica also show high dependence, with exports to the U.S. representing 16% and 13% of their respective GDPs, and in many countries, more than 40% of total exports.
In contrast, countries with export structures more oriented toward raw materials, such as Chile and Peru, show lower direct vulnerability. In these cases, China pays a predominant role as a trading partner, which reduces exposure to U.S tariff measures. The share of the U.S in their exports is equivalent to 5% and 3% of GDP, respectively.
Likewise, the Southern Cone shows low exposure to the U.S. market. In this subregion, Mercosur plays a key role in trade dynamics, consolidating itself as one of the main exchange blocks. Intra-regional trade in this area exceeds the average for the rest of Latin America.
Chart 4: US share in each country's exports vs. Change in growth expectations 2025
(% share, pp)
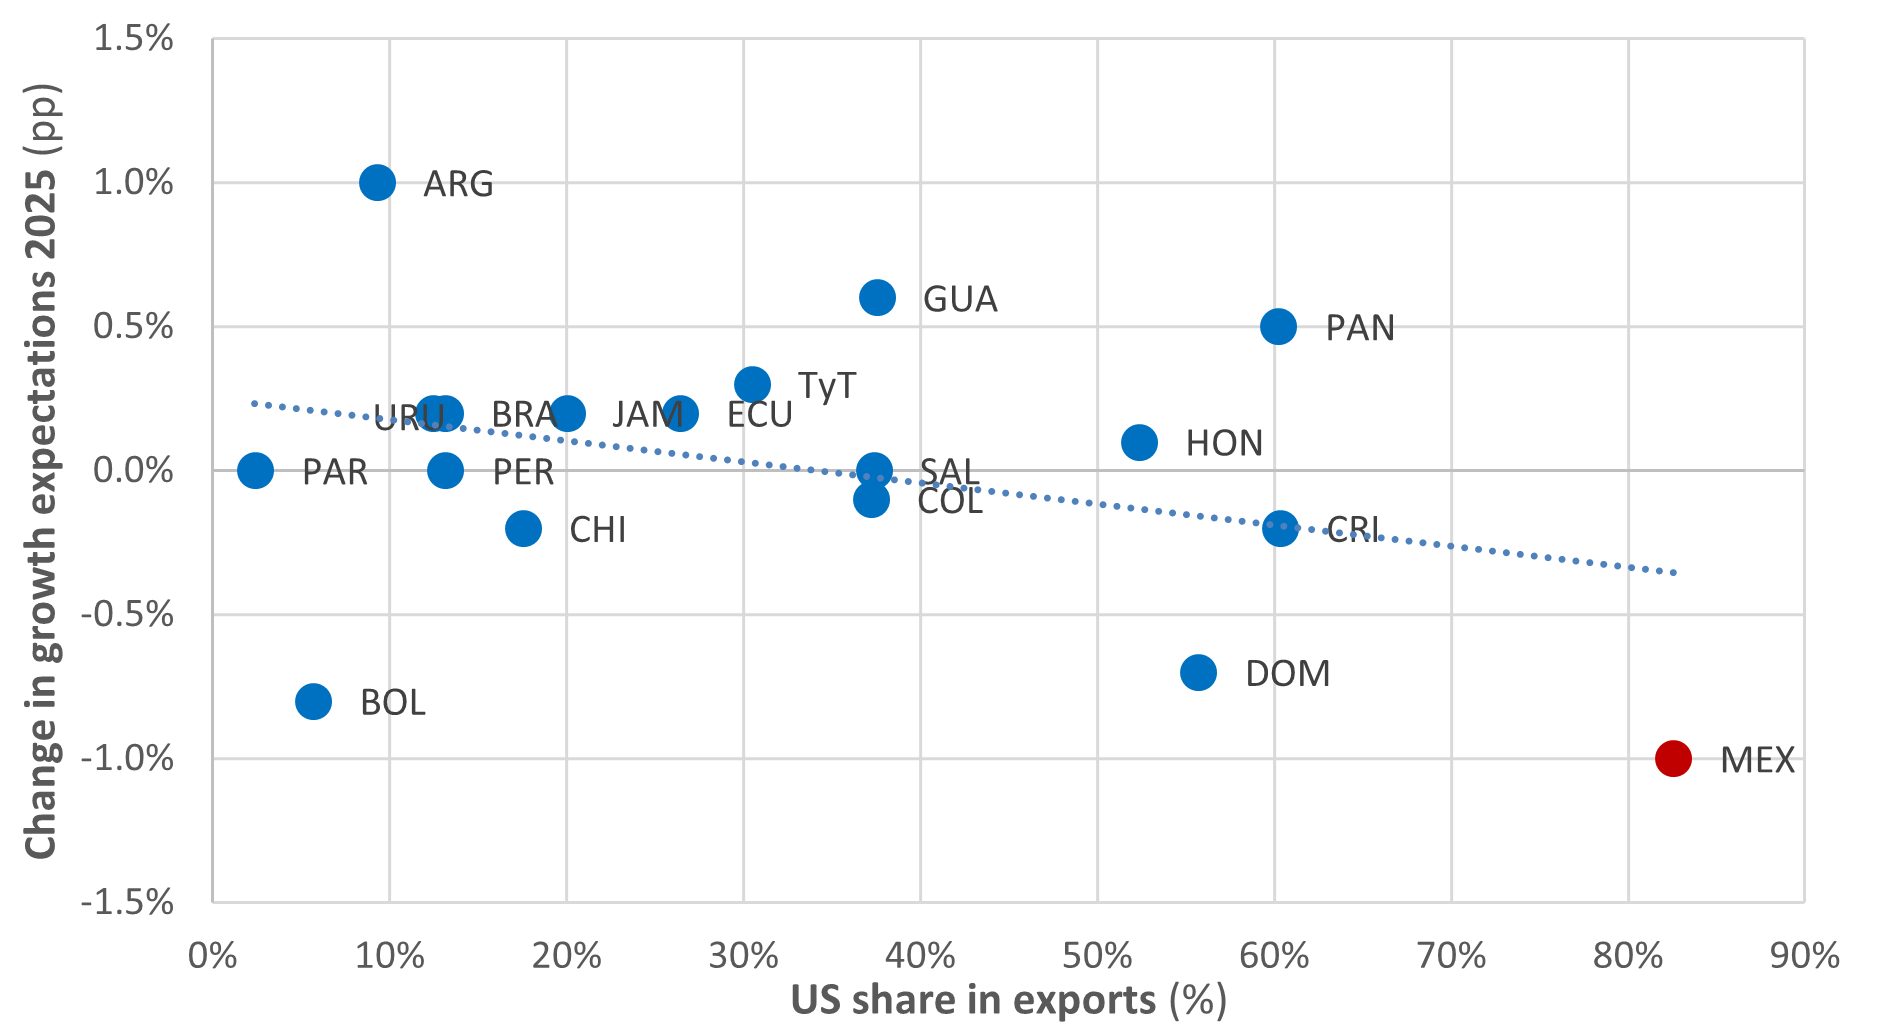
Source: The EIU – Trademap – Bladex Economic Research.
Despite the volatility and the constant extensions in the implementation of tariffs, changes in U.S. trade policy—or at least its announcements—have had significant impacts on global growth and inflation expectations, as slower growth and higher import costs are anticipated. Latin America has not been immune to these effects, although the magnitude has varied depending on each country’s level of trade exposure (Chart 4). Those with greater dependence on the U.S. market have seen more pronounced downward revisions in their growth projections. Mexico and Costa Rica, for example, have experienced reductions of -1.0pp and -0.2pp, respectively, highlighting how trade uncertainty can affect investment and consumption decisions.
However, this slowdown bias is not widespread. Most of the countries analyzed show upward revisions in their growth expectations, driven by idiosyncratic factors and the economic recovery cycle. There are also outlier cases: Argentina, for example, shows signs of recovery, while Bolivia reflects a deepening of its currency crisis, setting them apart from the regional trend.
So far, tariff shocks in Latin America have been contained, with few countries facing rates above 10%. Additionally, there are negotiation spaces that could improve tariff positioning with the United States, such as in the case of Mexico, which is preparing for the review of the T-MEC. This environment has generated moderate optimism in the markets regarding regional assets, reinforcing the hypothesis that Latin America could strategically capitalize on the dynamics of the “Trade War 2.0.”
Disclaimer
This presentation contains forward-looking statements of expected future developments within the meaning of the Private Securities Litigation Reform Act of 1995 and Section 21E of the Securities Exchange Act of 1934. Forward-looking statements can be identified by words such as: “anticipate”, “intend”, “plan”, “goal”, “seek”, “believe”, “project”, “estimate”, “expect”, “strategy”, “future”, “likely”, “may”, “should”, “will” and similar references to future periods. The forward-looking statements in this presentation include the Bank’s financial position, asset quality and profitability, among others. These forward-looking statements reflect the expectations of the Bank’s management and are based on currently available data; however, actual performance and results are subject to future events and uncertainties, which could materially impact the Bank’s expectations. Among the factors that can cause actual performance and results to differ materially are as follows: the coronavirus (COVID-19) pandemic and geopolitical events; the anticipated changes in the Bank’s credit portfolio; the continuation of the Bank’s preferred creditor status; the impact of increasing/decreasing interest rates and of the macroeconomic environment in the Region on the Bank’s financial condition; the execution of the Bank’s strategies and initiatives, including its revenue diversification strategy; the adequacy of the Bank’s allowance for expected credit losses; the need for additional allowance for expected credit losses; the Bank’s ability to achieve future growth, to reduce its liquidity levels and increase its leverage; the Bank’s ability to maintain its investment-grade credit ratings; the availability and mix of future sources of funding for the Bank’s lending operations; potential trading losses; the possibility of fraud; and the adequacy of the Bank’s sources of liquidity to replace deposit withdrawals. Factors or events that could cause our actual results to differ may emerge from time to time, and it is not possible for us to predict all of them. Readers are cautioned not to place undue reliance on these forward-looking statements, which speak only as of the date hereof. We undertake no obligation to publicly update any forward-looking statement, whether as a result of new information, future developments or otherwise, except as may be required by law.